Canola Market Supply and Demand
Each day, our team of experts meticulously analyze the latest market fundamental data, giving you a comprehensive understanding of the intricacies of the market. Whether you’re a farmer, investor, or industry stakeholder, our insights are designed to guide your decisions, helping you navigate challenges and capitalize on opportunities. Stay informed, stay ahead, and transform the way you engage with the agricultural market.
Global Canola Market – Supply and Demand Profile
February 7, 2024
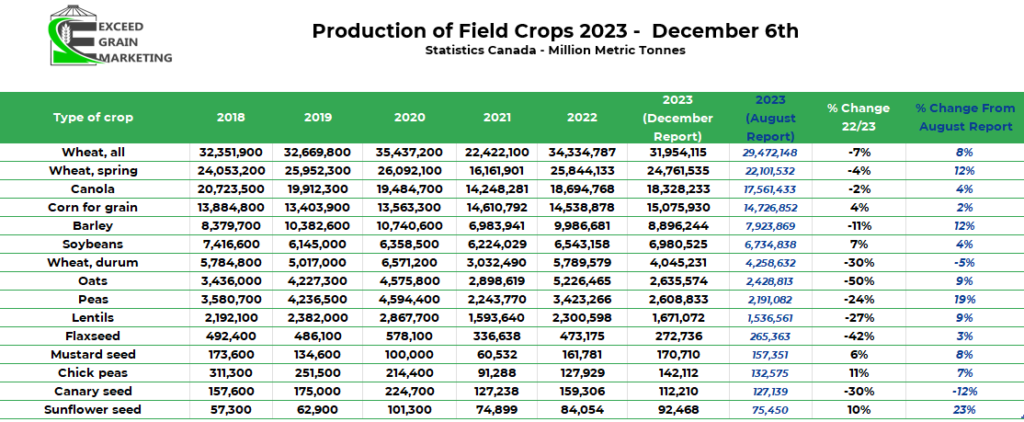
Western Canadian canola markets have suffered a pullback from levels seen pre harvest. The market has pulled from a $841 per tonne high set August 24th to now hovering around the $600 per metric tonne level for the front month of the futures. Similar pullbacks have been seen in a wide swath of commodities including energies and grains. WTI Crude oil down from a September high of $86 per barrel and now sits at just over $74 per barrel. King Corn is down $2.00 per tonne from its late June 2023 highs and Soybeans down $2.37 per bushel from the end of August.
Market has been caught in a long drawn out unwinding of the previous bull market and has been subject to significant managed money / hedge fund selling over the timeframe. In fact, managed money position in Canola is sitting at a record short position since it moved its trade from the Winnipeg office to the New York desk a few years back in the summer of 2018. Even when China vowed to ban canola imports from Canada the managed money stayed short less than 100,000 contracts. Managed money sits just shy of a 132,000 short position has hit some record positions in recent months.

Markets have been trading heavily on the anticipated lack of global demand and a bigger South American crop coming down the pipeline. We will have fresh USDA WASDE data out later today (Noon Eastern Time February 8th). At the time of publishing, pre February USDA WASDE report, the USDA sat with a 157mmt estimate, down from 161 mmt in December. Most analysts are anticipating a smaller crop (closer to the 153 mmt) figure in the February report.
Argentina, the other major South American soybean production nation is projected to put out a 50mmt crop which would be up from last years 25mmt crop. USDA sits at 2023/24 soybean global production of 398.9 mmt up from 375 mmt last year. Argentina has been very dry and hot over the past week but good rainfalls are forecasted for the coming days. Argentina’s weather is very important for the coming 2 -3 weeks as it finishes up its reproductive and enters its filling stages.
Markets stuck in a bearish tone as there is no immediate perceived supply threat to a wide swath of markets. South American weather has posed a threat at times but the market appears to be satisfied with the current projections. It will be a large crop regardless, whether we shave a few mmt here or there.
Markets really mostly concerned about demand and demand going forwards. There is some ocean logistical issues affecting global supply routes but is especially affecting US Gulf Coast trade into Asia as the Panama Canal continues to pose issues to bulk freight due to water level issues. Gulf grains need to ship around the horn of Africa to reach Asian markets.
Now to look at Canola specifically. For the given time of the year, producers still holding inventory, crushers have not had to be competitive with exporters and exporters are lagging in sales to other nations. The immediate threat of supply scarcity has yet to have shown up domestically.
Canola shipments have proven to be relatively lackluster in recent weeks as weekly data from the Canadian Grain Commission posted only 61,000 metric tonnes of exports in week 26 of the marketing year. In the week prior, 34,600 tonnes was the figure.
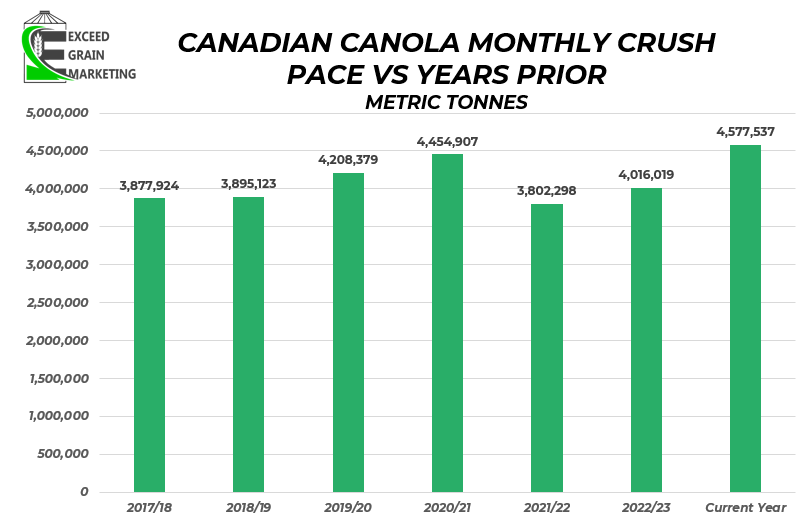
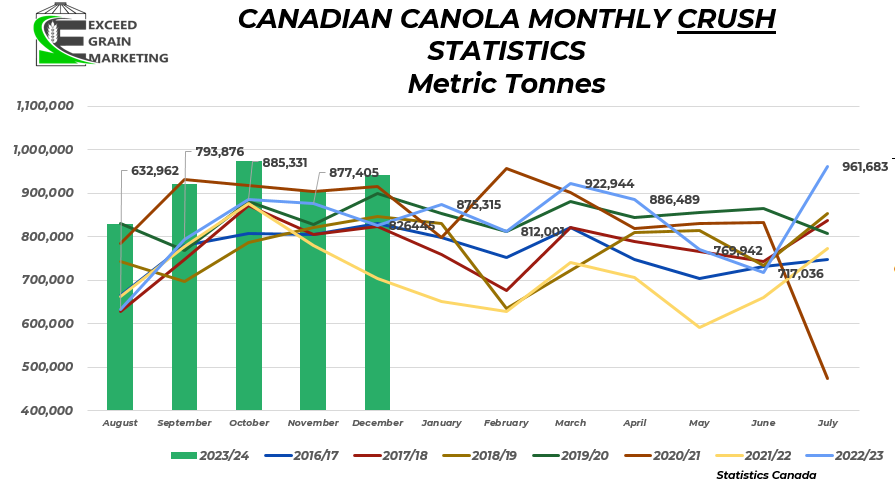
Domestic Usage (Proxy for Crush) has been running very strong and we are on pace for a record crush pace. We have new crush capacity coming online here in 2024 in eastern Saskatchewan and we should get an additional 2mmt of crush capacity per year for the coming marketing session 2024/25. More will be online when the crusher around Regina fires up a little later, anticipated early 2025.
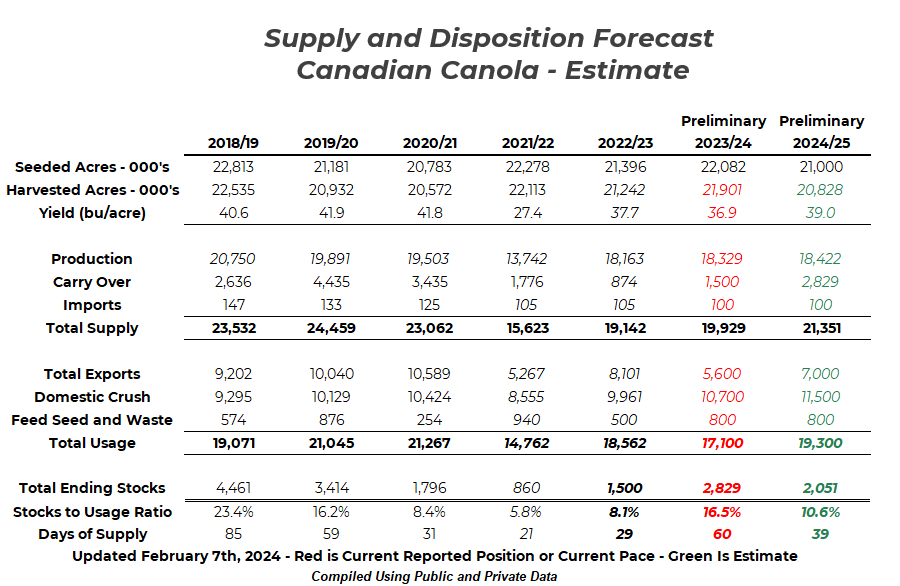
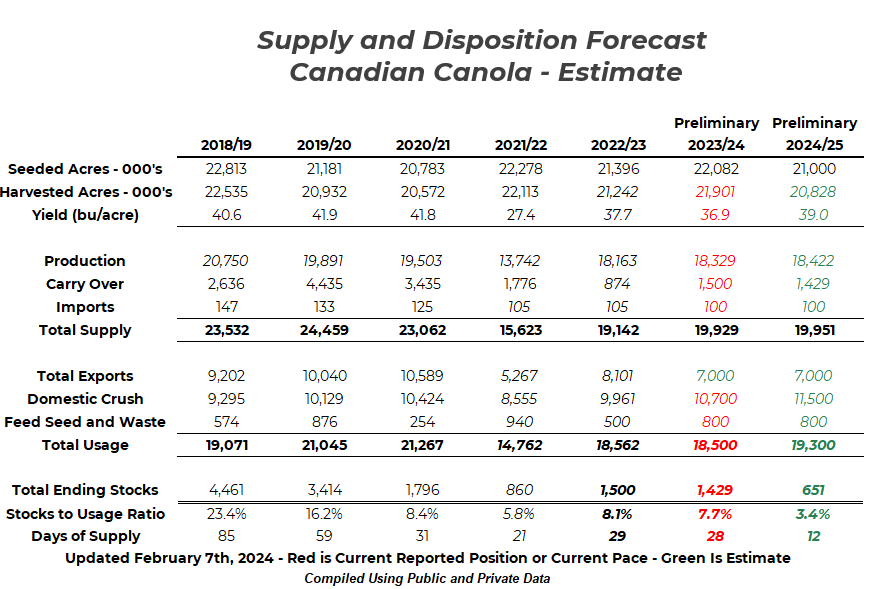
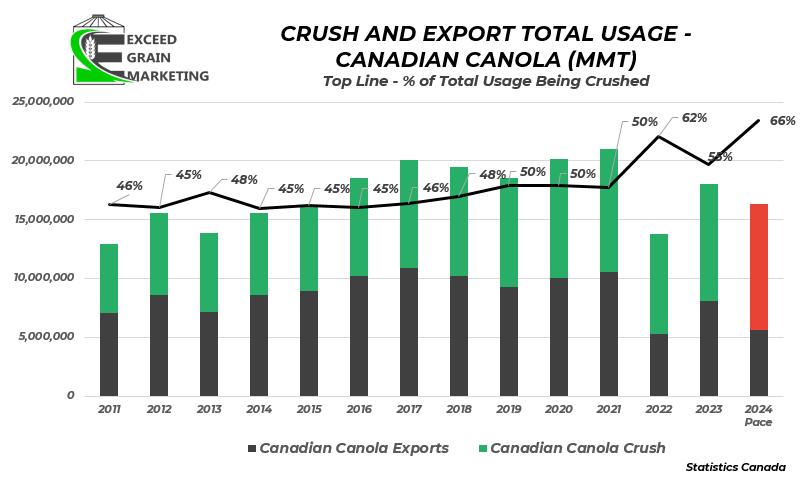
Top image above is our “On Pace” for figures, moreso for context. Bottom image would highlight the tightness if we export the previously forecasted 7.0 mmt. Exports will be the number to watch going forwards
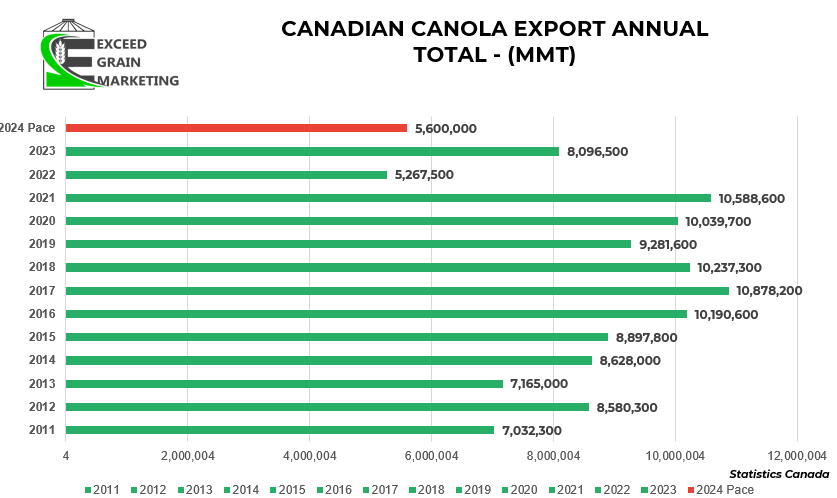
Taking a look at some Supply and Demand estimates we can make a few assumptions. Highlighted in red above are current “On Pace For” figures and are not to serve as a forecast. So as of right now we are on pace for 5.6 mmt of exports from Canada for this years canola crop. Most private analysts at 7.0 mmt and the USDA still sits at 7.7 mmt of canola exports, an optimistic approach to exports but also reasoning why local, boots on the ground, analysis does help in these situations. To get to 7.7 would be considered a huge homerun at this point in the marketing game. We are just crossing over the halfway point of the marketing year and currently in week 26 of the marketing year. Canola exports sit at 2.8 mmt vs last years 4.3 mmt of exports. We need to pick up the pace in an aggressive manner and have a strong last half of exports to meet early the 7.0mmt + estimates. Statistics Canada’s December export figures came in at the lowest for the month since 2006, nearly 20 years.
Exports need to be closer to 161,000 tonnes each week in order to hit the 7.0 MMT pace. We are currently tracking towards 5.6 mmt annual exports. Carryout and market sentiment will shift largely based upon this figure. We have lost some of our traditional export sales to Mexico this year for instance as Australia took some of the business from Canada. But when referring to China, we are on pace to hit sales goals into there. The coming weeks will be very important to watch.
Week 26 we had 442,000 tonnes of grain move off of producer farms into the commercial handling system, the largest volumes since Week 11, ending October 15th. Prime harvest delivery season. While we need to see a few more weeks of strong deliveries, there is optimism that there will be a railcar and a ship on the other side of these deliveries as well.
December Canola Oil exports released in recent days. December posted the strongest month since December of 2020, which is of relatively little surprise as Crush has been very strong. Almost all of the oil went to the United States.
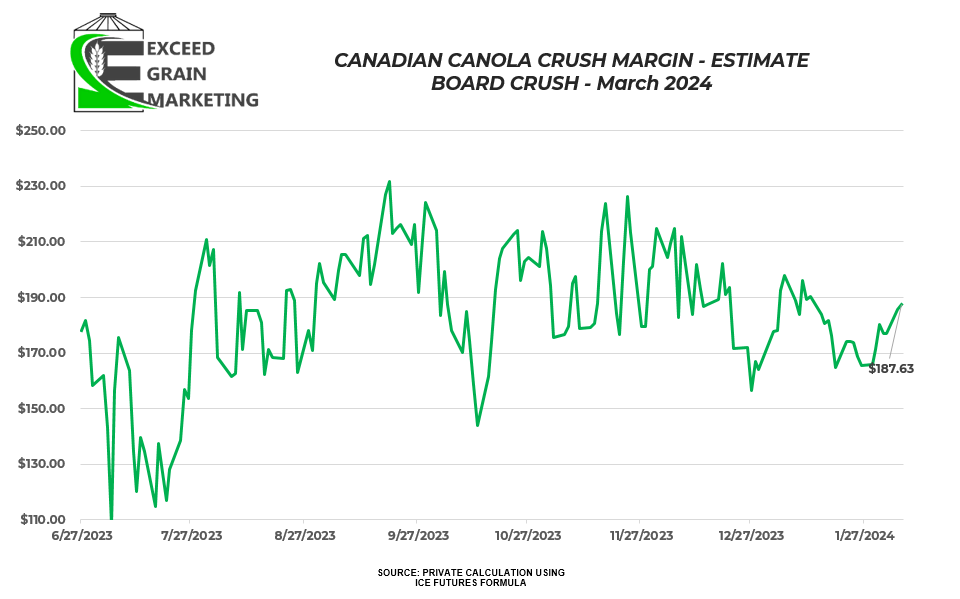
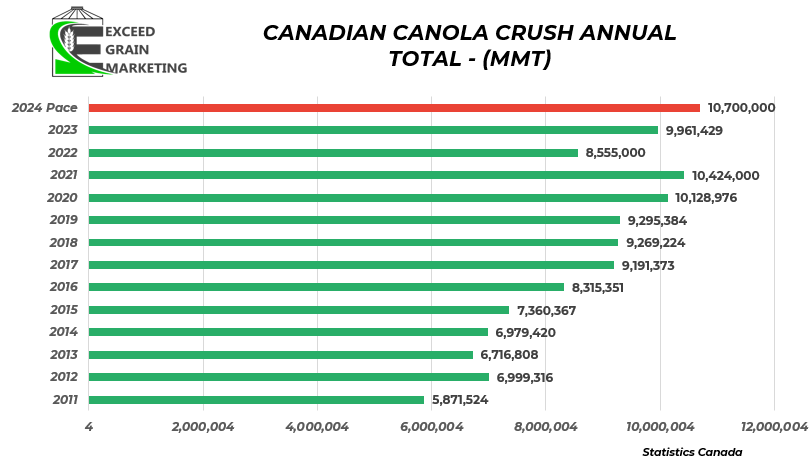
Crush is the strongest figure going and keeping sanity within the marketplace. Crush is on pace for close to 11 million tonnes (10.7mmt) which would be a record. The addition of crush capacity in eastern Saskatchewan largely behind this anticipated record pace. More crush capacity is slated to be online in fall and by end of 2024 we should have almost an extra 2 mmt of crush capacity online vs 2023.
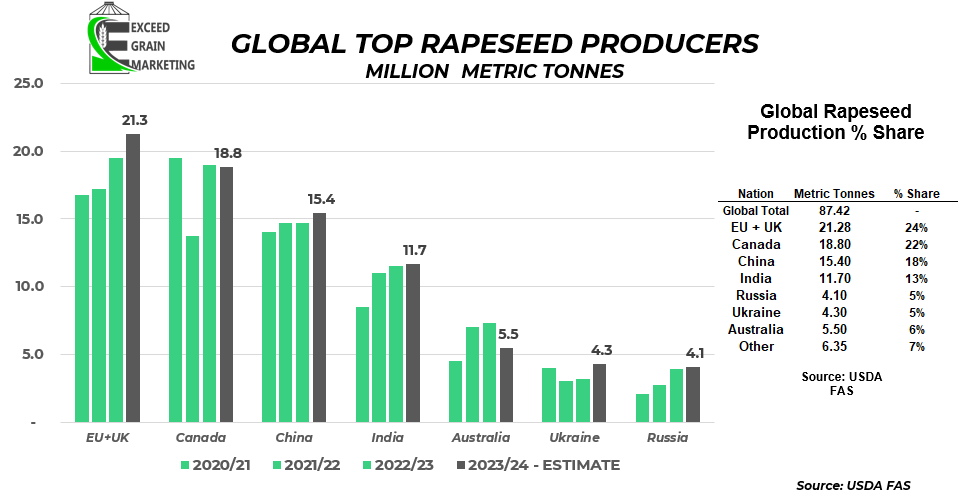
We are likely going to face a carryout of 2.0 mmt or greater of a carryout this year. Current canola acreage forecasts are falling for 2024 crop acres in Canada and private analysts are in the 21.500 million acre camp, but this will ebb and flow in the next few weeks. The worlds largest canola producer in recent years has been the European Union, often putting out a crop of a competitive size to Canada. Private analysts have the upcoming crop at 18.5 +- range. Less acres for the winter seeded crop. EU canola will be coming out of dormancy in April. It has been very wet in northern Germany, France and Poland where a majority of the acreage presents itself.


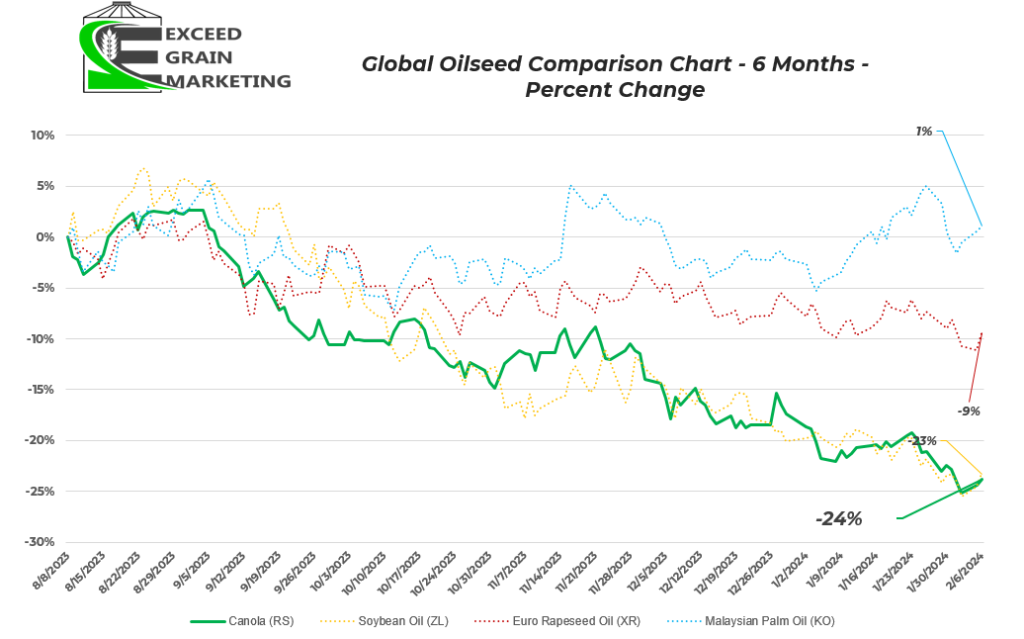
Taking a look at the chart above, Canola has fell 24% from the beginning of August. Soybean oil down 23%. European Rapeseed and Malaysian Palm Oil futures have been faring quite well as the brunt of the damage has been felt within the North American marketplace. Malaysian Palm Oil managing a small gain
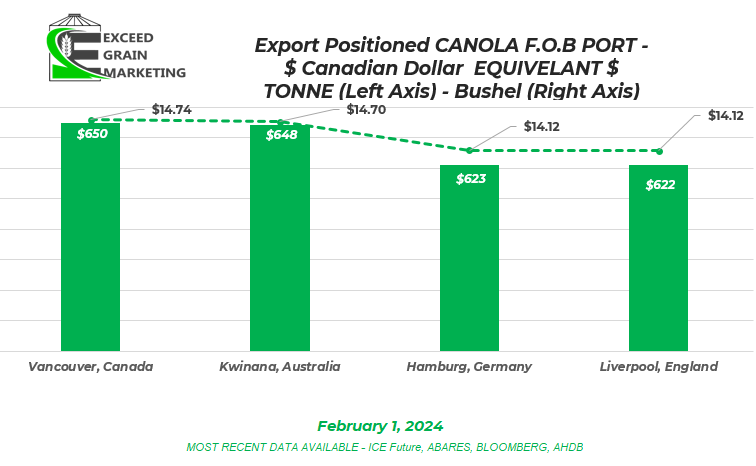
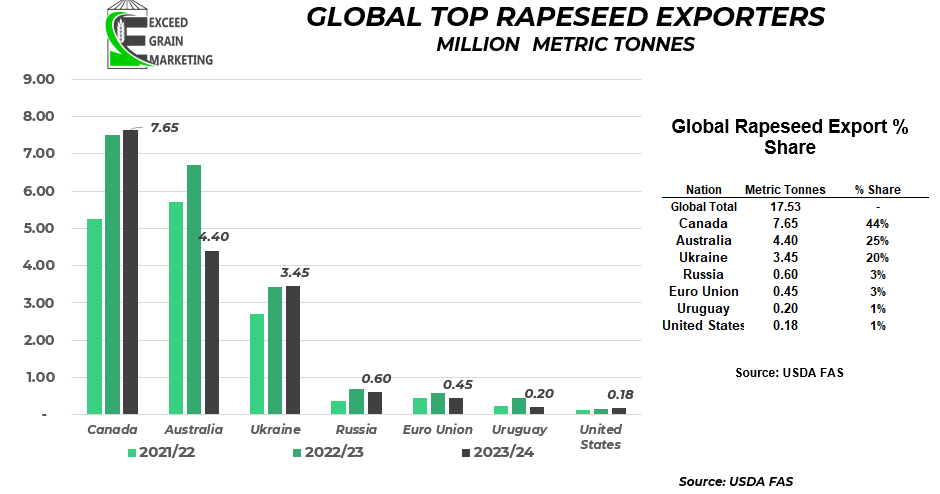
Canadian canola has lost some of its marketing price premium over Australian Canola in recent months as well. Australia is just off of a fresh 5 mmt harvested crop and is looking to hit exports hard as they typically only crush right around 1mmt. Australian canola typically has a freight advantage into Asia vs Canada due to a bit shorter ocean freight, only about $10 per metric tonne although. Canadian canola was often holding a $100 per tonne premium to Australian canola Now the premium has fell and in recent weeks the two FOB locations have traded at PAR with each other. Australia keeps the $10 per tonne freight advantage although, it still does make Canadian canola ripe for purchases to a willing buyer when we get close to parity.
Some Export Charts Below highlighting 2022/23 export Destinations and 2023/24 export destinations so far. We have some fairly delayed data in Canada and most recent full monthly data available is for the end of December. We have weekly CGC data but it does not break it out as nice as the monthly data does. Lastly, a comparison chart from August to November for this marketing year and the previous marketing year. Canadian exporters have missed out so far on all European business with the exception of a ship into Belgium in September. EU has been getting cheaper eastern European rapeseed and the German / EU Crop crop was of decent quantity this year as well.
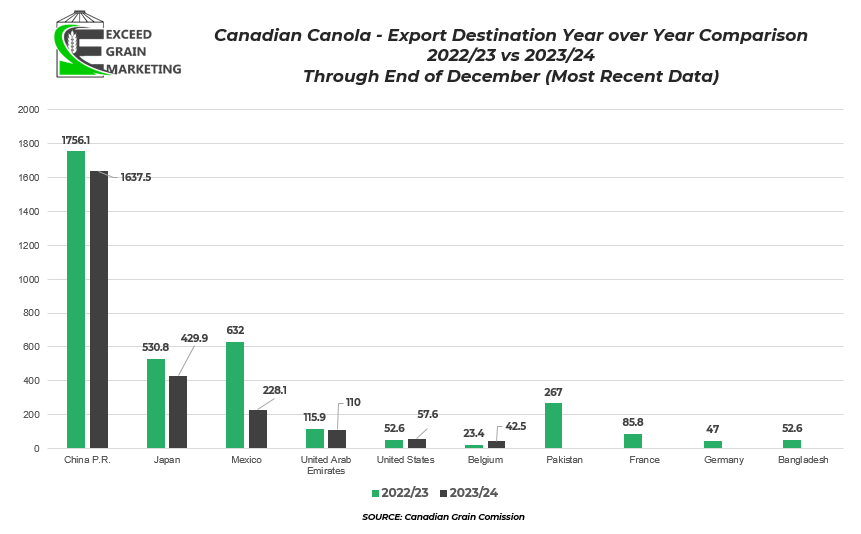
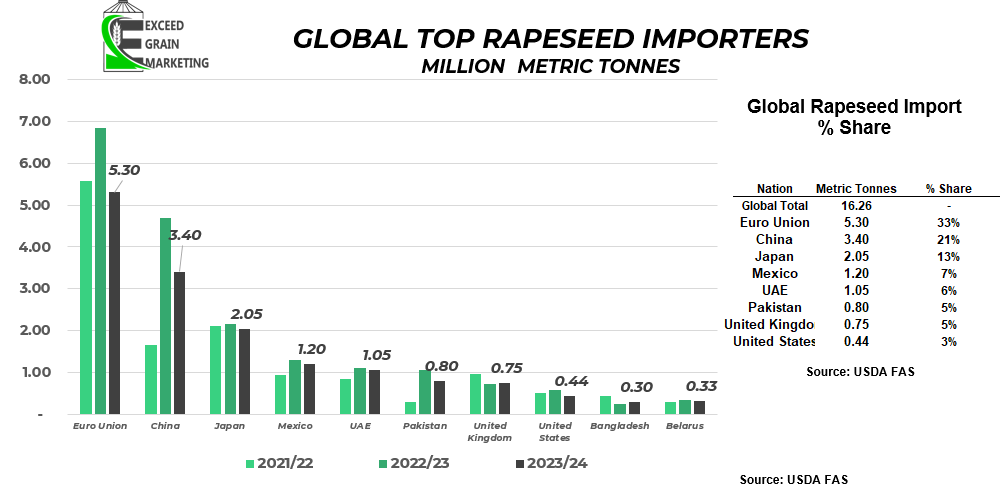
China Mexico and Japan, Our top three importers have took less canola to date for the first few months of the marketing year. Pakistan has been absent from the market so far.
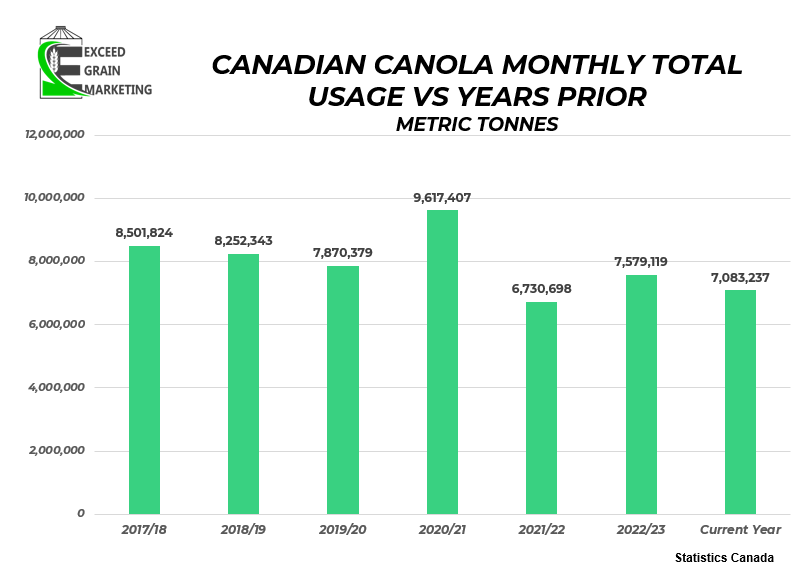
Export Pace, Year over Year for the past 7 Years.
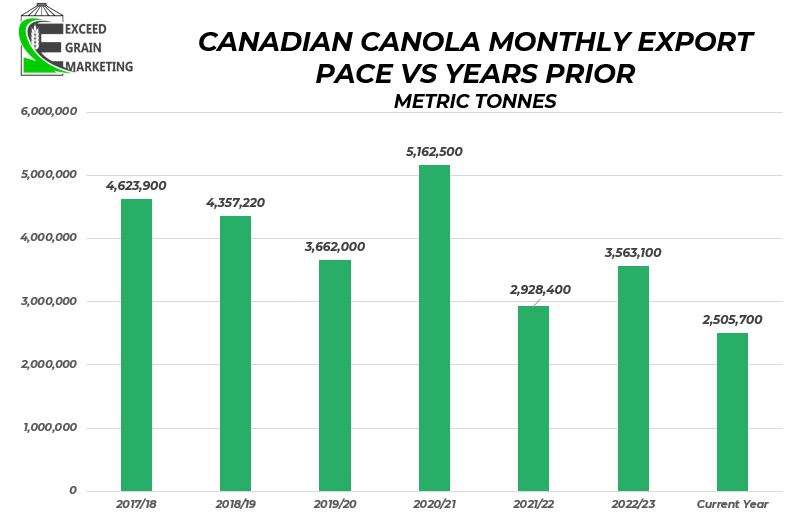
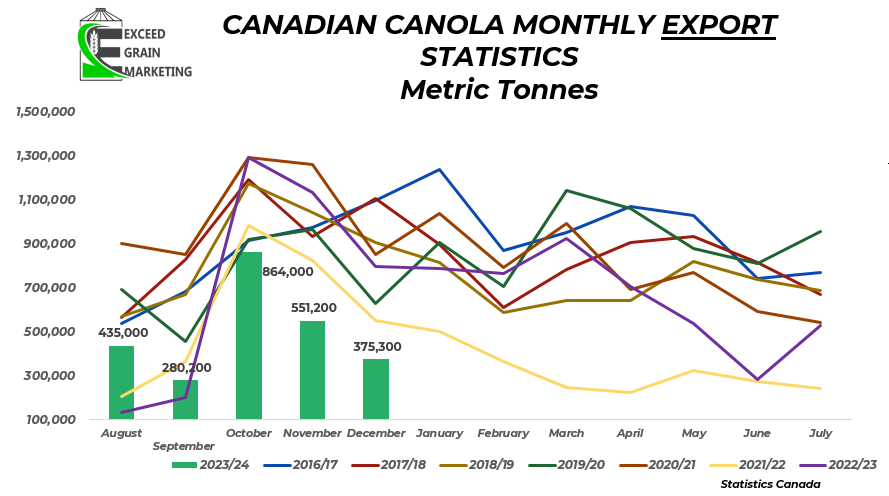
Crush Pace is running an excellent figure. Crush is currently at a record pace and is taking care of some of the missed exports so far.
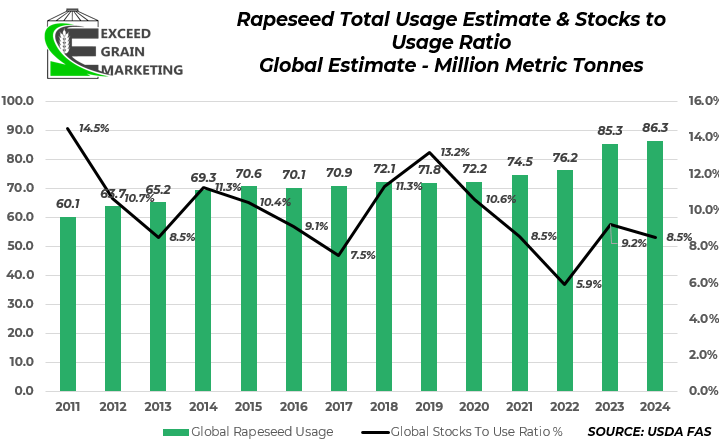
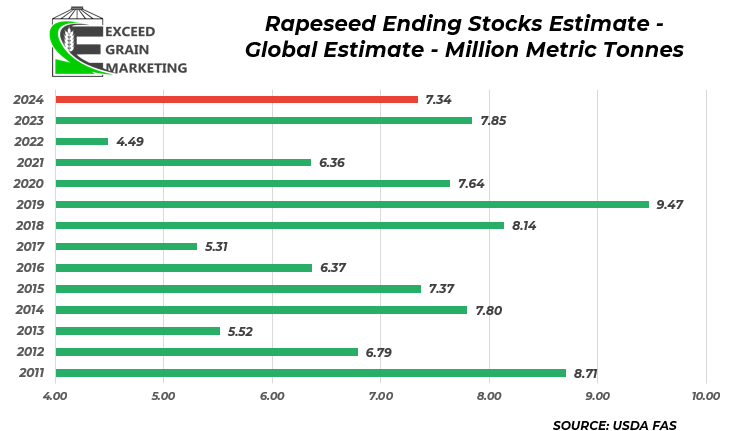
Global Rapeseed Ending Stocks expected to come in slightly below last years figures. Essentially 1 mmt more usage from last year and smaller net production from some of the other smaller rapeseed producers globally will result in the lower ending stocks. Part of the drop, although they still produced a large crop, Australian production falling nearly 3mmt year over year.
Our market intelligence reports incorporate information obtained from various third-party sources, government publications, and other outlets. While we endeavor to maintain the highest standards of accuracy and integrity in our reports, we acknowledge that the information provided may contain inadvertent errors or omissions. As such, we accept no liability for any inaccuracies or missing information in the data presented. Furthermore, these reports are not intended to serve as standalone investment or financial advice. We strongly advise that any financial or investment decisions be made in consultation with a professional market advisor. Reliance on the content of our reports for making financial decisions without such professional advice is at the sole risk of the user.

