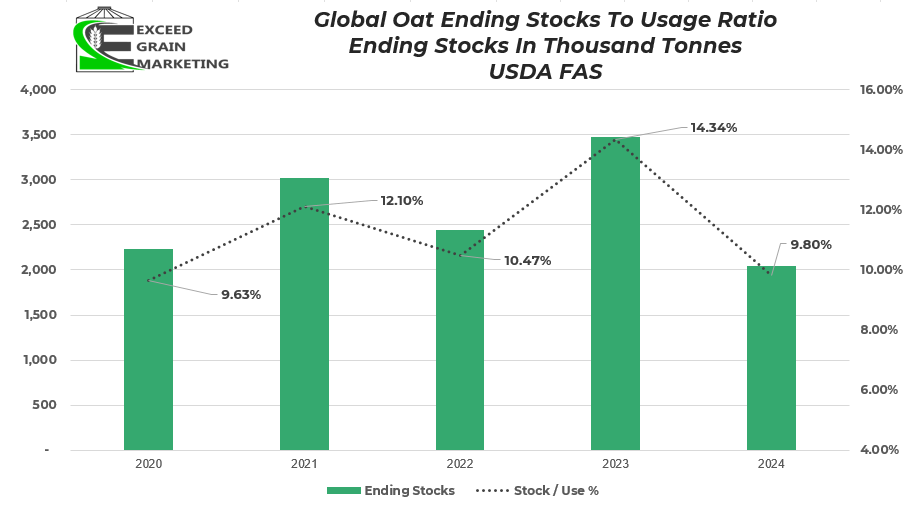
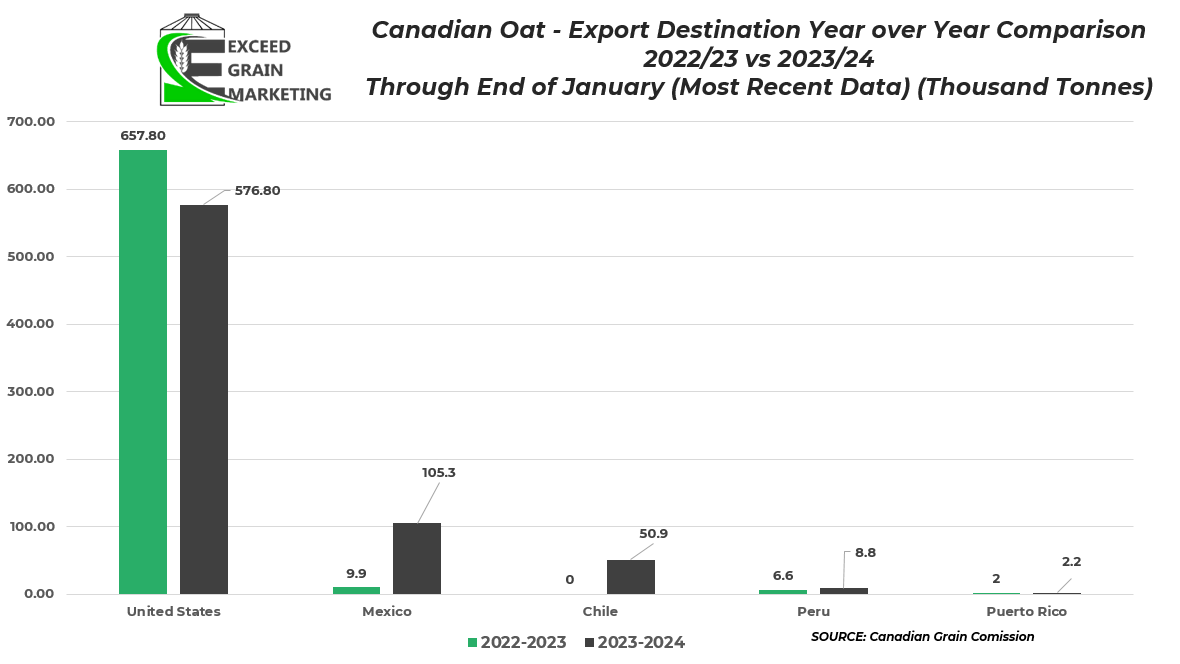
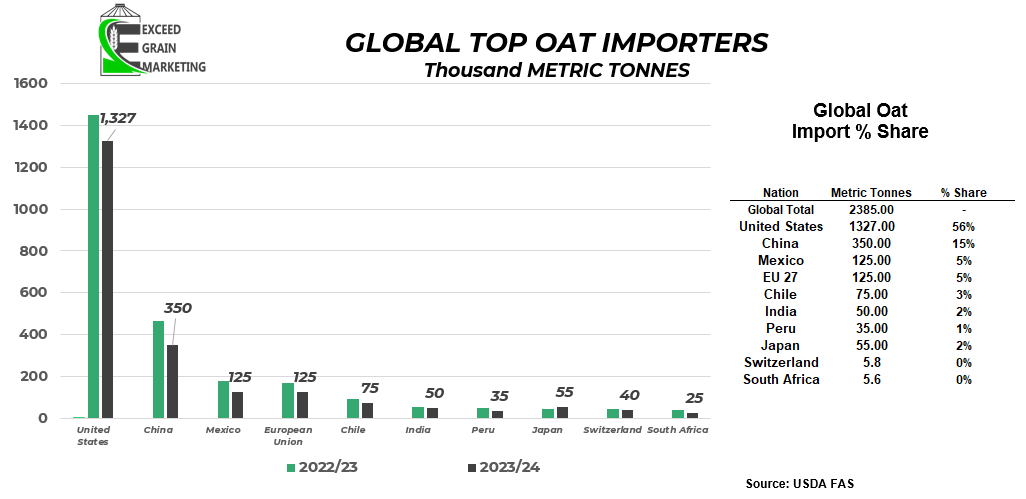
This weeks feature is on Canadian and Global OAT fundamentals. Few key highlighted notes listed below:
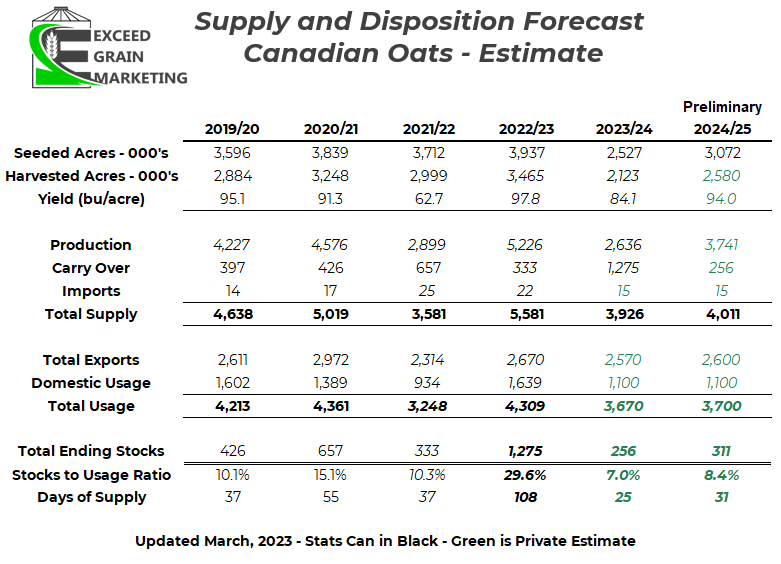
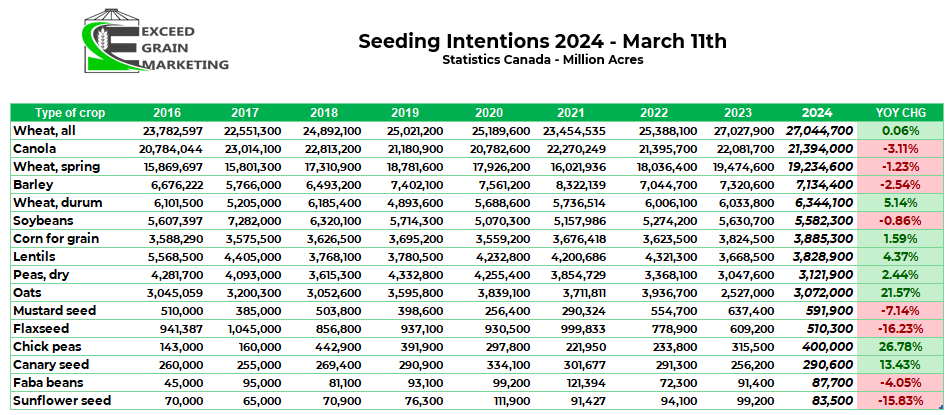
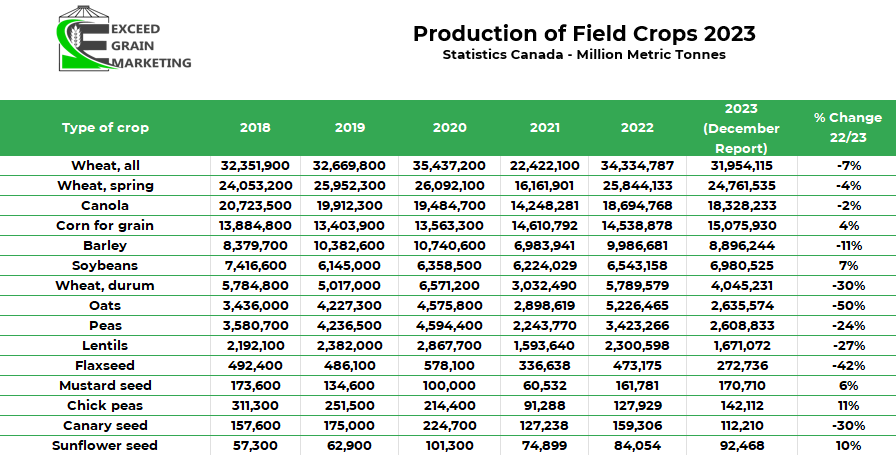
- Statistics Canada has Canadian oat acres coming in at 3.07 million acres for the upcoming year. A 22% increase year over year due to last years very low acreage figures. Oat acres returning to what would be considered to still sit near the low end of the 5 Year Average, see chart below.
- Statistics Canada completed their survey of oat acreage from mid December to mid January, planting intentions have likely shifted slightly since then, especially with oat production as producers can sometimes pull or add acres from a rotation easier than some other crops.
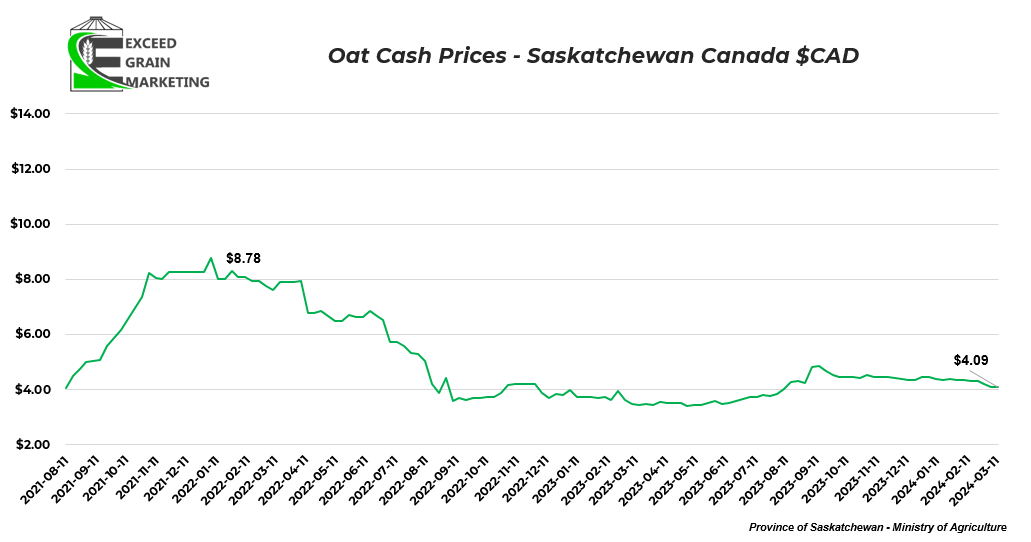
- New crop oat pricing range anywhere from $4.20 to $4.50 for the time being. Earlier opportunities for $5.00+ were limited in acres and to identity preserved or certain agronomic practices. One needs to fully understand their cost of production and create a marketing plan if growing these or any other crops.
- Oat Supply and Demand chart below:
- Take the chart with a grain of salt. Projections can and will change as we get closer to seeding. By taking a look at the chart although we can see that global carryout will remain quite tight, same story goes for Canadian oats as well. Yields, Acreage and Demand will ebb and flow so the charts are to serve as a working tool to help us take a look forwards and see what could potentially play out.
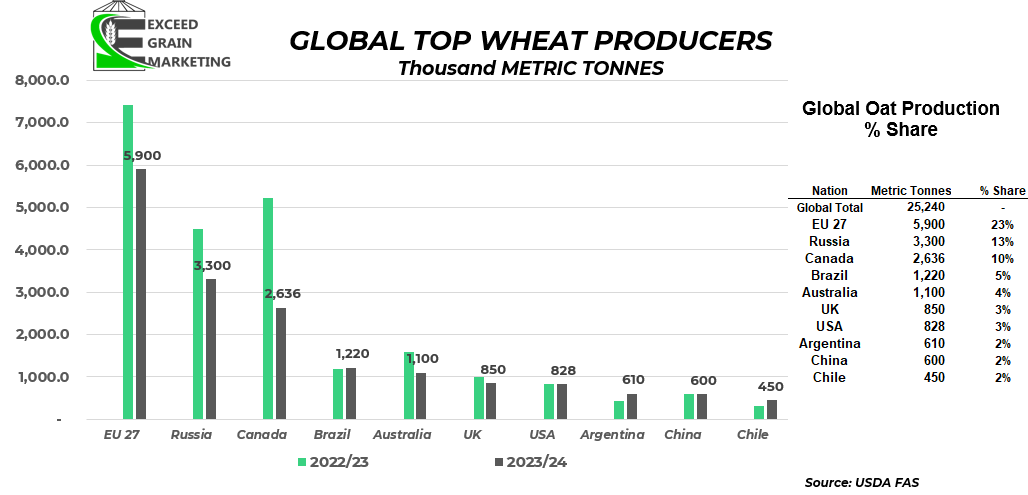
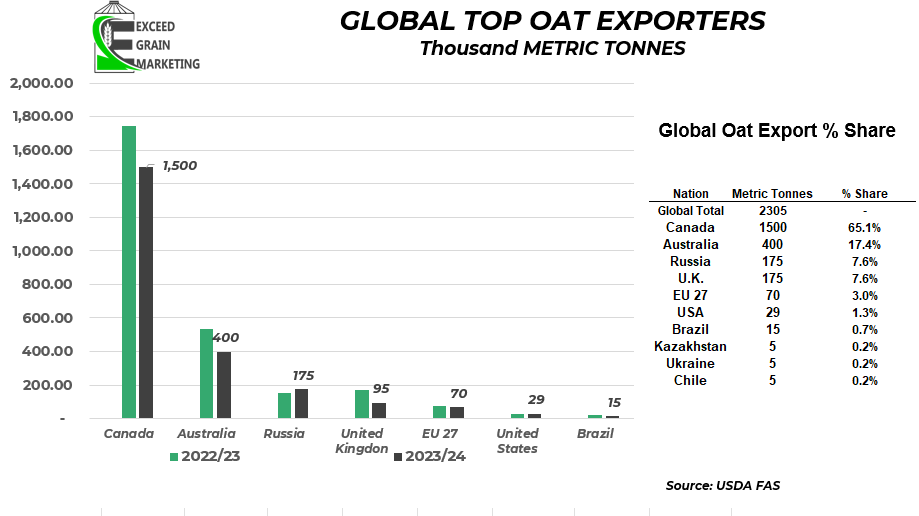
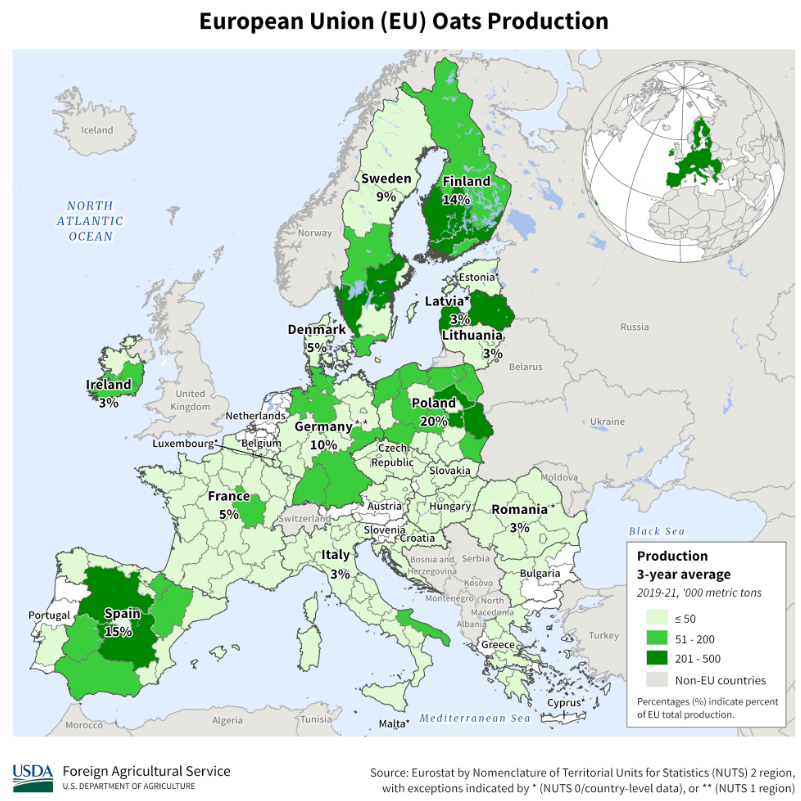
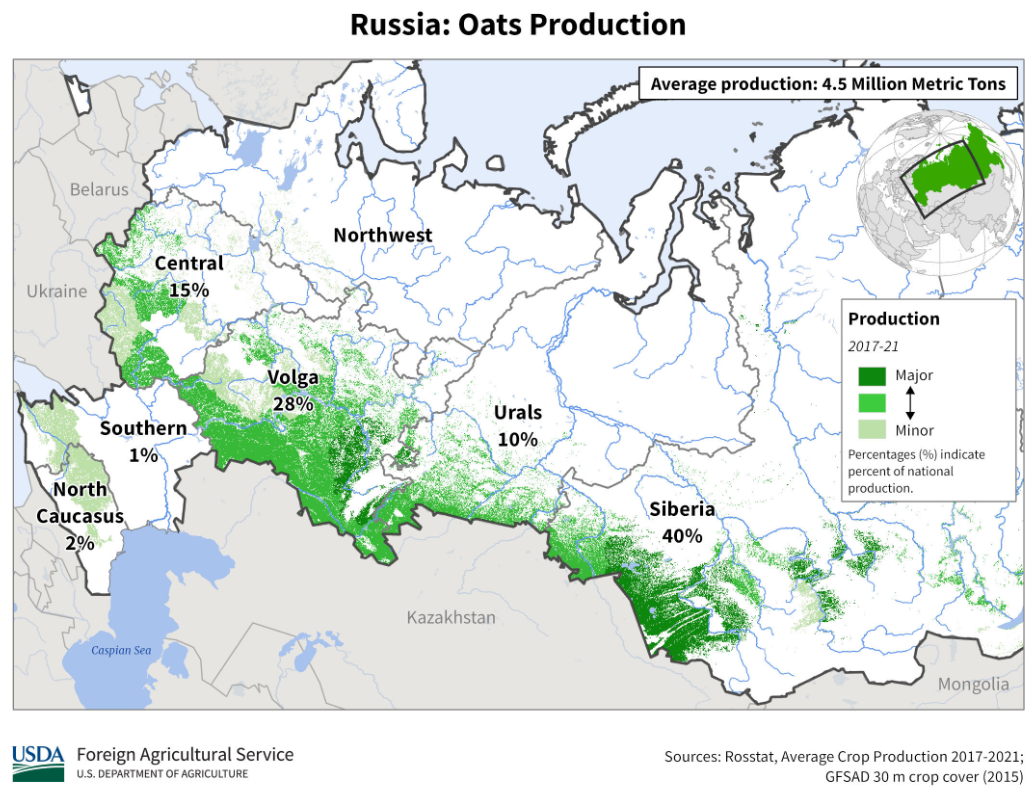
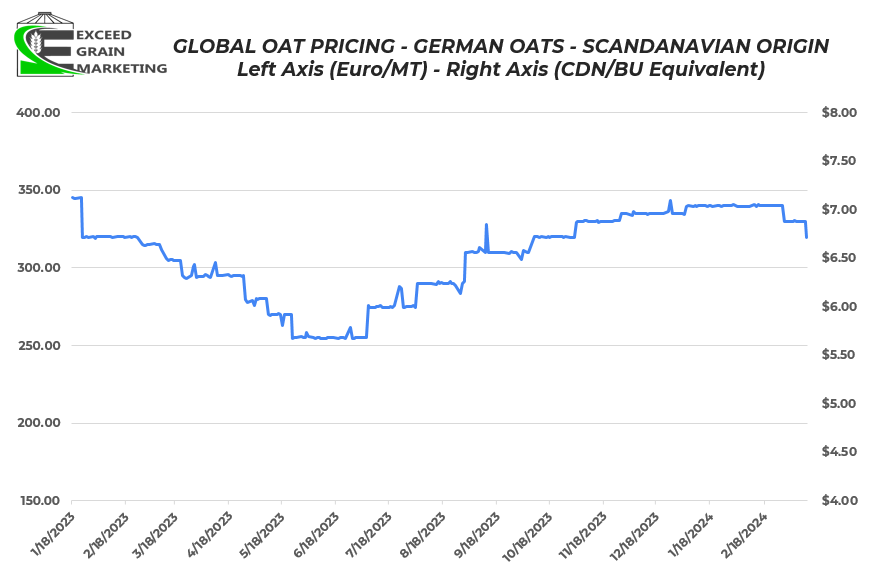
- European oat prices have picked up since their harvest time, you will see a chart below of Scandinavian oats shipped into Germany. Different market forces at play. Essentially the European Union, Canada and Russia dominate the majority of global production.
Market Fundamentals – Oats
